AutoDock Vina

1.    Overview and Installation

AutoDock Vina [1] is a program for molecular docking, originally developed by Dr. Oleg Trott at The Scripps Research Institute. It predicts how a small molecule (the ligand) binds to a macromolecular target (the receptor) and ranks the resulting poses using an empirical scoring function.

Official Website: https://vina.scripps.edu/

Download Page: https://vina.scripps.edu/downloads/

AutoDock Vina runs on Linux, macOS, and Windows. On Debian- and Ubuntu-based Linux distributions, it can also be installed from the terminal:

sudo apt install autodock-vina

A video tutorial is also available on YouTube:

https://www.youtube.com/watch?v=-GVZP0X0Tg8.

Setting up the docking calculations requires the installation of supporting software:

MGLTools [2]: used to prepare the receptor and ligand files and to analyze the docking results. Download the version that matches your operating system from the official MGLTools downloads page:

https://ccsb.scripps.edu/mgltools/downloads/

Open Babel [3]: used to convert the files produced by AutoDock Vina into PDB format. Installation instructions are available here:

https://open-babel.readthedocs.io/en/latest/Installation/install.html

For Linux installations, Open Babel can be installed using the following command:

sudo apt install openbabel

RasMol: used to visualize PDB structures. It can be downloaded from its official webpage:

http://www.openrasmol.org/

On Linux, RasMol can be installed with:

sudo apt install rasmol

Together, AutoDock Vina, MGLTools, Open Babel, and RasMol provide everything needed to set up, run, and analyze a docking calculation.

2.    Acquiring PDB Structures for Docking

Docking a ligand into a receptor requires PDB structures for both molecules. The ligand structure can be constructed using various programs such as GaussView or Avogadro [4]. Optimizing the ligand geometry with a quantum-chemistry package such as Gaussian or ORCA is recommended, because AutoDock Vina keeps bond lengths and bond angles fixed during docking and samples only the rotatable torsions; the starting geometry therefore has a direct effect on the quality of the result. Convert the optimized structure back to PDB format with Open Babel. The receptor structure can be downloaded from the Protein Data Bank (PDB). In the worked example used throughout this page, the substrate sinigrin is docked into myrosinase from Sinapis alba, using the structure of the enzyme in complex with gluco-hydroximolactam and sulfate (PDB ID: 1E6S).

The procedures described below are written for Windows and Linux.

2.1        Create a Working Directory

Create a working directory on your local drive, for example F:\Dropbox\Methods\docking on Windows or ~/Dropbox/Methods/docking on Linux.

Example command (Linux):

mkdir -p ~/Dropbox/Methods/docking

2.2        Download and Rename the Receptor File

Download the receptor file (1E6S.pdb) into your working directory and rename it to receptor.pdb.

Example commands (Linux):

wget https://files.rcsb.org/download/1E6S.pdb

mv 1E6S.pdb receptor.pdb

2.3        Clean the Receptor File

2.3.1       Remove the Unnecessary Records from the receptor.pdb File

Keep only the records that begin with ATOM, HETATM, or TER, and discard the remaining header and annotation records. On Linux this can be done with the command below; on Windows, edit the file manually in a text editor.

grep -E "^ATOM|^HETATM|^TER" receptor.pdb > t.pdb

mv t.pdb receptor.pdb

2.3.2       Select the Chains to Work With

A single chain can be extracted with our in-house program PDBtoORCA, which is freely available on GitHub:

https://github.com/iranimehdi/pdbtoorca


pdbtoorca   <<EOF

receptor.pdb

chain

A

A.pdb

q

EOF


pdbtoorca   <<EOF

receptor.pdb

chain

B

B.pdb

q

EOF


If two chains are required, run the commands above for each chain and then merge the resulting files:

cat A.pdb B.pdb > AB.pdb


2.3.3       Remove Crystal Waters and Hetero Groups

Remove crystal water (HOH) lines and all hetero groups from the end of the receptor.pdb file. Once the docking is complete, the crystal waters can be added back, discarding any that make short contacts with the docked ligand, with other waters, or with protein residues. This is particularly advisable if QM/MM calculations are planned.

Note: for metalloproteins, active-site metal ions should be retained, because they often coordinate the ligand directly and are part of the binding site.

grep -E "^ATOM" receptor.pdb > t.pdb

grep -E "^ATOM" AB.pdb > AB-clean.pdb

2.4        Isolate the Test Ligand

Extract lines with the identifier "GOX" from the 1E6S.pdb file and copy them into a new text file named test-ligand.pdb. GOX (D-gluconhydroximo-1,5-lactam) is a transition-state analogue that occupies the glucose-binding subsite of the enzyme; bound together with a sulfate ion, it mimics the enzyme-substrate complex [5]. Its position therefore provides a convenient way of defining the search space in section ‎3.1.4.

For Linux, execute the following command:

grep 'GOX' 1E6S.pdb > test-ligand.pdb

The test-ligand.pdb file now contains the GOX records, while receptor.pdb is cleaned and ready for the next steps. Only the HETATM lines are needed to define the search space. The contents of the test-ligand.pdb file.

HET    GOX  M 921      13

HETNAM     GOX (2S,3S,4R,5R)-6-(HYDROXYAMINO)-2-(HYDROXYMETHYL)-2,3,4,

HETNAM   2 GOX  5-TETRAHYDROPYRIDINE-3,4,5-TRIOL

HETSYN     GOX D-GLUCONHYDROXIMO-1,5-LACTAM

FORMUL  11  GOX    C6 H12 N2 O5

HETATM 4334  C1  GOX M 921      46.871 119.891  52.844  1.00 12.77           C

HETATM 4335  N1  GOX M 921      46.180 119.101  52.013  1.00 14.84           N

HETATM 4336  C2  GOX M 921      47.752 119.220  53.910  1.00 11.14           C

HETATM 4337  N5  GOX M 921      46.714 121.224  52.640  1.00 13.32           N

HETATM 4338  O7  GOX M 921      45.512 119.568  50.983  1.00 19.98           O

HETATM 4339  O2  GOX M 921      47.199 118.054  54.530  1.00 11.49           O

HETATM 4340  C3  GOX M 921      48.249 120.259  54.889  1.00 11.04           C

HETATM 4341  O3  GOX M 921      49.347 119.649  55.564  1.00 11.04           O

HETATM 4342  C4  GOX M 921      48.648 121.507  54.062  1.00 12.38           C

HETATM 4343  O4  GOX M 921      49.290 122.463  54.907  1.00 11.97           O

HETATM 4344  C5  GOX M 921      47.312 122.173  53.572  1.00 13.58           C

HETATM 4345  C6  GOX M 921      47.406 123.456  52.773  1.00 13.67           C

HETATM 4346  O6  GOX M 921      48.187 123.278  51.578  1.00 15.18           O


Finally, set up the protein and assign the protonation states of its titratable residues. This step matters, because the protonation pattern determines which hydrogen bonds can form in the active site. A step-by-step guide is available here:

https://prof.uok.ac.ir/m.irani/index_files/Page517.htm

3.    Converting Files to Vina Format and Setting Up Docking Calculations

3.1        Preparing the Receptor

3.1.1       Launch MGLTools and open the receptor.pdb file (File/Read Molecule) from your working directory.

3.1.2       Add polar hydrogens to the receptor (Edit/Hydrogens/Add/Polar Only). AutoDock Vina uses a united-atom model in which non-polar hydrogens are merged into the atoms they are bonded to, so only polar hydrogens are required.

3.1.3       Save the prepared receptor.pdb structure in PDBQT format (Grid/Macromolecule/Choose). MGLTools assigns Gasteiger charges and AutoDock atom types automatically. Save the file as receptor.pdbqt in your working directory.

3.1.4       Setting Up the Search Space

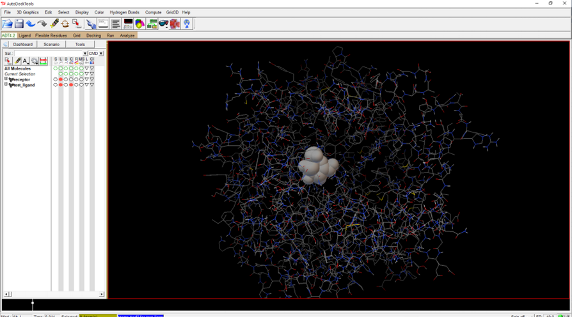
3.1.4.1       Open the test-ligand.pdb file in MGLTools (Ligand/Input/Open). Figure 1 shows the test ligand inside the receptor.


Figure 1. The test ligand (space fill in the center), inside the receptor.


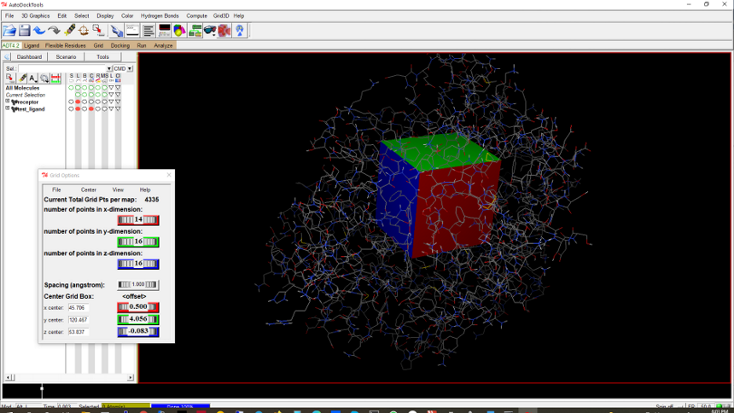
3.1.4.2       Click Grid/Grid Box to open Grid Options (refer to Figure 2).

3.1.4.3       Set the grid spacing to 1.0 Å so that the box dimensions are expressed directly in ångströms. To do this, hold down the left mouse button on the fourth slider (the black rectangle in Figure 2) and drag it to the right until the value reads 1.0.

3.1.4.4       Adjust the box so that it completely encloses the test ligand. MGLTools draws the faces of the search space in red, green, and blue for the x, y, and z directions, respectively. The size and the center of the box are changed with the corresponding sliders in the Grid Options window.

3.1.4.5       Record the xy, and z sizes, center xcenter y, and center z values for later use in AutoDock Vina (4.3).

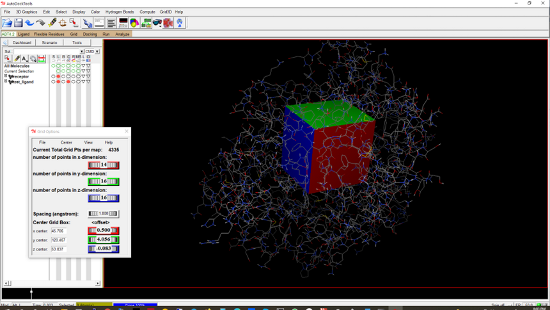
Figure 2. The receptor and the search space around the test ligand. The Grid Options window is shown on the left-hand side.


3.1.5       Converting the Ligand (Substrate) Structure to pdbqt Format


If the ligand has no hydrogens, add polar hydrogens (Edit/Hydrogens/Add/Polar Only) and compute Gasteiger charges (Edit/Charges/Compute Gasteiger). An optimized PDB structure of sinigrin is shown below as an example.

HETATM    1  O4  CGT   503      -2.756  -7.478   7.839                       O

HETATM    2  H11 CGT   503      -2.899  -6.536   7.635                       H

HETATM    3  C6  CGT   503      -3.195  -8.124   6.636                       C

HETATM    4  H9  CGT   503      -2.782  -9.134   6.591                       H

HETATM    5  H10 CGT   503      -4.284  -8.211   6.672                       H

HETATM    6  C5  CGT   503      -2.791  -7.320   5.383                       C

HETATM    7  O9  CGT   503      -2.755  -5.900   5.749                       O

HETATM    8  H8  CGT   503      -3.549  -7.545   4.628                       H

HETATM    9  C4  CGT   503      -1.413  -7.685   4.784                       C

HETATM   10  O3  CGT   503      -1.253  -9.067   4.471                       O

HETATM   11  H7  CGT   503      -0.860  -9.055   3.580                       H

HETATM   12  H6  CGT   503      -0.619  -7.381   5.470                       H

HETATM   13  C3  CGT   503      -1.314  -6.892   3.470                       C

HETATM   14  O2  CGT   503      -0.138  -7.225   2.740                       O

HETATM   15  H5  CGT   503       0.214  -6.376   2.418                       H

HETATM   16  H4  CGT   503      -2.190  -7.115   2.855                       H

HETATM   17  C2  CGT   503      -1.247  -5.402   3.815                       C

HETATM   18  O1  CGT   503      -1.190  -4.775   2.536                       O

HETATM   19  H3  CGT   503      -1.897  -5.226   2.040                       H

HETATM   20  H2  CGT   503      -0.314  -5.210   4.351                       H

HETATM   21  C1  CGT   503      -2.429  -4.920   4.723                       C

HETATM   22  H1  CGT   503      -3.339  -4.714   4.139                       H

HETATM   23  S1  CGT   503      -1.928  -3.396   5.623                       S

HETATM   24  C10 CGT   503      -2.333  -3.542   7.323                       C

HETATM   25  C7  CGT   503      -3.685  -3.028   7.764                       C

HETATM   26  C8  CGT   503      -3.757  -1.526   7.910                       C

HETATM   27  C9  CGT   503      -4.834  -0.802   7.653                       C

HETATM   28  H15 CGT   503      -4.819   0.278   7.780                       H

HETATM   29  H16 CGT   503      -5.793  -1.238   7.386                       H

HETATM   30  H14 CGT   503      -2.835  -1.040   8.219                       H

HETATM   31  H12 CGT   503      -3.992  -3.519   8.690                       H

HETATM   32  H13 CGT   503      -4.340  -3.355   6.953                       H

HETATM   33  N1  CGT   503      -1.542  -3.977   8.252                       N

HETATM   34  O5  CGT   503      -0.263  -4.418   7.792                       O

HETATM   35  S2  CGT   503       1.039  -3.633   8.294                       S

HETATM   36  O7  CGT   503       0.593  -2.273   8.465                       O

HETATM   37  O8  CGT   503       1.455  -4.267   9.516                       O

HETATM   38  O6  CGT   503       2.008  -3.778   7.252                       O

END


3.1.5.1       Restart MGLTools.

3.1.5.2       Open the ligand.pdb file (Ligand/Input/Open) in MGLTools to add Gasteiger charges and detect rotatable bonds automatically.

3.1.5.3       If necessary, edit the set of rotatable bonds (Ligand/Torsion Tree/Choose Torsions). Rotatable bonds are shown in green and non-rotatable bonds in red; amide bonds, which are not rotated by default, are shown in magenta (see Figure 3).

3.1.5.4       Save the ligand structure as ligand.pdbqt (Ligand/Output/Save as PDBQT). Exit MGLTools after saving.


Figure 3. Representation of the ligand in MGLTools. Rotatable and non-rotatable bonds are shown in green and red, respectively.

4.    Docking by AutoDock Vina

4.1        Windows users can open the command prompt by searching for "cmd" in the taskbar search box, while Linux users can open a terminal.

4.2        Navigate to the working directory (e.g., cd \Dropbox\Methods\docking). On Windows, switch to another drive by typing its letter followed by a colon (e.g., F:).

4.3        Create a configuration file (conf.txt) in the working directory with the docking options. Use the xy, and z sizes, center xcenter y, and center z values obtained from step 3.1.4.5. Here's an example conf.txt file:

receptor = receptor.pdbqt

ligand = ligand.pdbqt

out = out.pdbqt

center_x = 43.223

center_y = 118.899

center_z = 54.290

size_x = 16

size_y = 14

size_z = 10

cpu = 4

num_modes = 10

energy_range = 3

exhaustiveness = 8


4.4        Run the docking calculation with AutoDock Vina

On Windows: Open Command Prompt and navigate to the AutoDock Vina installation directory. Then run the command:

"C:\vina\vina.exe" --config conf.txt > log.txt

On Linux: Run the command:

vina --config conf.txt > log.txt

5.    Analyzing the Output Files

5.1        Split the binding modes into separate files with vina_split

On Windows:

"C:\vina\vina_split.exe" --input out.pdbqt

On Linux:

vina_split --input out.pdbqt

5.2        Convert each PDBQT file produced by vina_split into PDB format with Open Babel. For example, the first binding pose (from the out.pdbqt file) is converted as follows, giving out.pdb:

obabel -i pdbqt -o pdb out_ligand_1.pdbqt -O out_ligand_1.pdb

5.3        Visualize the binding modes inside the receptor

The receptor and a docked pose can be combined into a single complex file with the cat command:

cat receptor.pdb out_ligand_1.pdb > com.pdb

 Each out.pdb file contains one binding pose of the ligand. To inspect a pose inside the receptor, open the combined complex file created above (instead of out.pdb) together with the receptor.pdb file in a visualization program such as RasMol, PyMOL, or UCSF ChimeraX.

The binding modes can also be inspected in MGLTools (Analyze/Docking/Open AutoDock Vina Results/out.pdbqt/Multiple molecules, then Grid/Macromolecule/Open/receptor.pdbqt). Figure 4 shows one binding mode inside the enzyme.


Figure 4. One of the binding modes inside the enzyme.

6.    Exercise

Locate the binding site of each of the receptors listed below and dock xevinapant (PubChem CID: 25022340) into it.

Receptors and structure sources:

LC3-p62 complex (PDB ID: 2ZJD)

Beclin 1 evolutionarily conserved domain (PDB ID: 4DDP)

cIAP1-BIR3 in complex with the N-terminal peptide of caspase-9 (PDB ID: 3D9T)

Receptor-interacting serine/threonine-protein kinase 3 (RIPK3; AlphaFold model of UniProt entry Q9Y572)

7.    References

[1]      O. Trott, A.J. Olson, Software news and update AutoDock Vina: Improving the speed and accuracy of docking with a new scoring function, efficient optimization, and multithreading, J. Comput. Chem. 31 (2010) 455–461. https://doi.org/10.1002/jcc.21334.

[2]      G.M. Morris, R. Huey, W. Lindstrom, M.F. Sanner, R.K. Belew, D.S. Goodsell, A.J. Olson, AutoDock4 and AutoDockTools4: Automated docking with selective receptor flexibility, J. Comput. Chem. 30 (2009) 2785–2791. https://doi.org/10.1002/jcc.21256.

[3]      N.M. O'Boyle, M. Banck, C.A. James, C. Morley, T. Vandermeersch, G.R. Hutchison, Open Babel: An open chemical toolbox, J. Cheminform. 3 (2011) 33. https://doi.org/10.1186/1758-2946-3-33.

[4]      M.D. Hanwell, D.E. Curtis, D.C. Lonie, T. Vandermeersch, E. Zurek, G.R. Hutchison, Avogadro: an advanced semantic chemical editor, visualization, and analysis platform, J. Cheminformatics 2012 41. 4 (2012) 1–17. https://doi.org/10.1186/1758-2946-4-17.

[5]      W.P. Burmeister, S. Cottaz, P. Rollin, A. Vasella, B. Henrissat, High resolution X-ray crystallography shows that ascorbate is a cofactor for myrosinase and substitutes for the function of the catalytic base., J. Biol. Chem. 275 (2000) 39385–93. https://doi.org/10.1074/jbc.M006796200.


University of Kurdistan, Sanandaj logo

Department of Chemistry, Faculty of Science, University of Kurdistan